About MH21-S
Technical Challenges
The first production test (2013) and the second production test (2017) in the Eastern Nankai Trough managed to achieve depressurization and to stably produce methane gas for six days and twenty four days per one well respectively. Along with operational challenges such as sand control and flow assurance, the most critical problem to be addressed in terms of the future of commercially viable gas production from the hydrate reservoir was the gas production rate. The maximum gas production rate achieved was around 20,000 m3 in the AT1-P well (2013), which is below the target rate (noted above) of 50,000 m3/day. Some numerical models had predicted that the gas rate could be increasing with time, however, such behavior was not yet observed in any of the prior tests. The gas water ratio which was also expected to show rising tendency with time, did not increase (see article).
The analyses of monitoring data in production and observation wells, as well as the history matching between numerical model results and actual production behavior, indicate two factors that likely hindered stable and increasing gas production rates. One was the excess water supply from the reservoir, which mainly arose from the heterogeneous occurrence of methane hydrates and the existence of adjacent water-bearing zones. Another factor was a pressure drop across the wellbore surface and sand control device (skin), which prevented the drawdown of the formation pressure, even when the bottomhole pressure was reduced. The unconsolidated nature of the reservoir may have contributed to the latter factor.
A risk analysis of the above factors was conducted to gain insights into prevention and mitigation measures. The development of these measures is considered to be the most important part of the Phase Four study. Several ideal and actual methane hydrate dissociation scenarios, along with examples of preliminary risk analysis results related to the excess water supply problem, are shown in Fig.2.
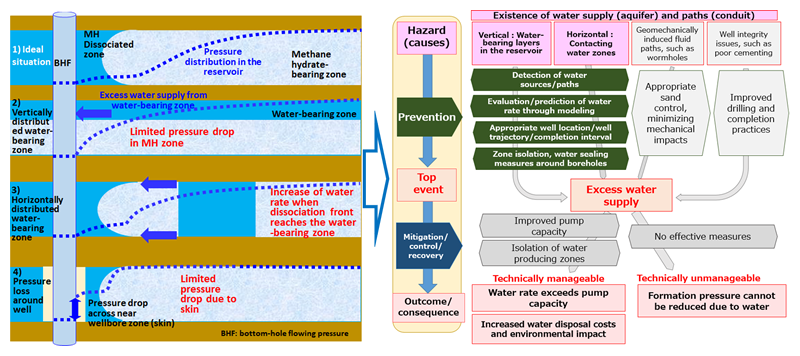
Fig.2 MH dissociation scenarios behind the borehole surface (ideal case and troubled cases, left) and an example of a risk and prevention/mitigation analysis chart (an excess water supply scenario, right)
